My amazing collaborators and I will be presenting our research on annotation,
visualization design guidance, and accessible visualization. Below you’ll find what each paper is
about, along with its session, time, and room. We hope to see you there!
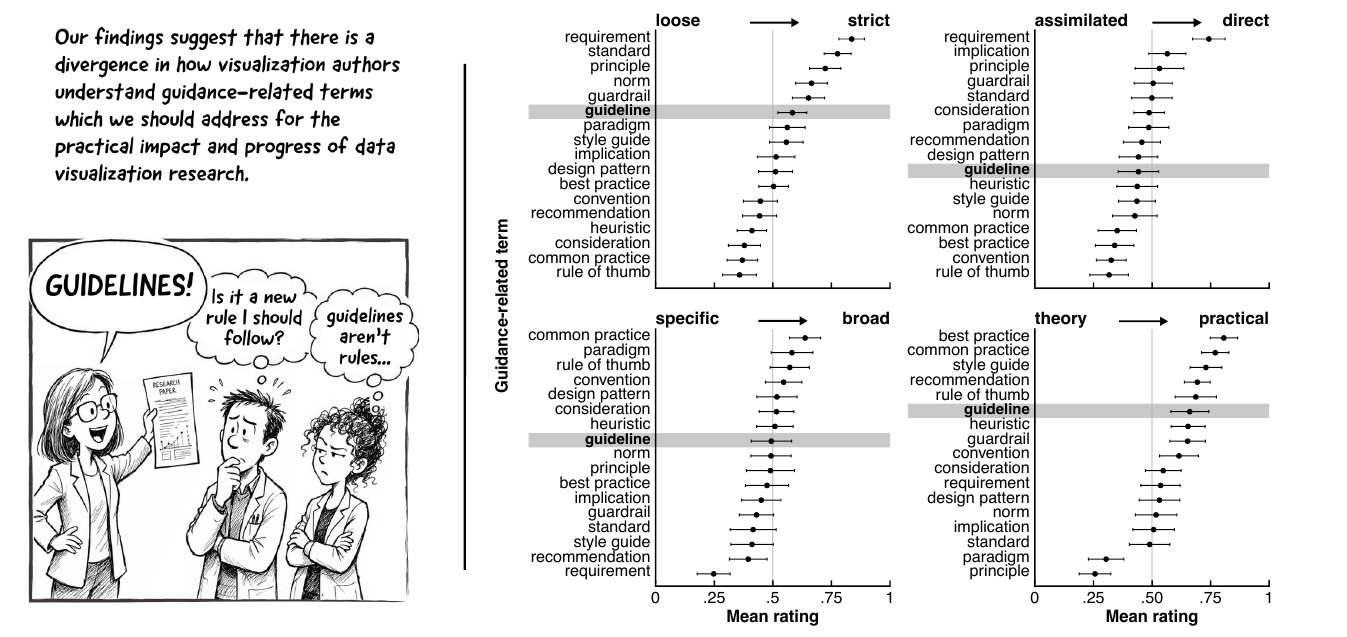
Visualization research often presents its findings as “guidelines,” yet researchers
read that word in different ways. Drawing on an expert study, a crowdsourced study, and the
terminology of 3,877 IEEE VIS papers, we examine how the community understands it alongside related
terms such as heuristic, best practice, and rule of thumb.
Presented by Anna L. Chinni and Md Dilshadur Rahman
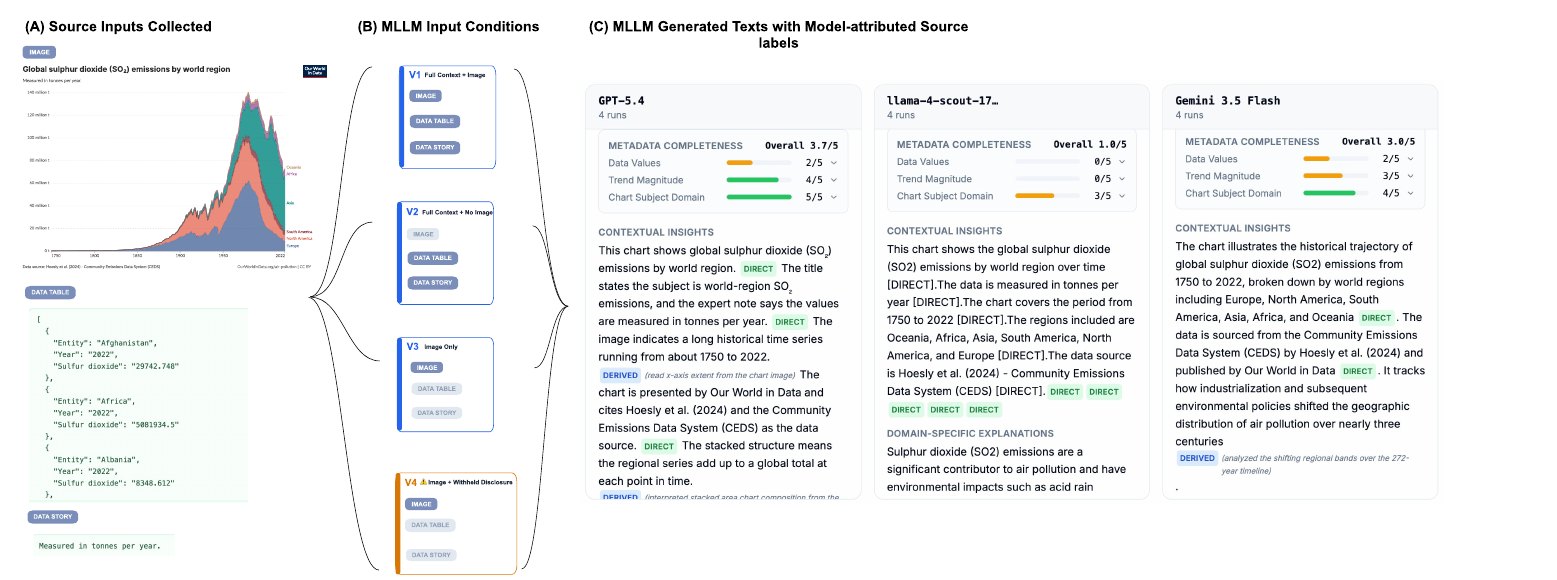
Multimodal language models are now used to describe charts for blind and low-vision
readers, but it is not always clear where their statements come from. We examined 1,224 descriptions
of 102 charts from three models, labeling each claim as stated in the chart, derived from it, or
speculative. Adding data tables, captions, and alt text made claims more grounded; explanations of
real-world significance stayed mostly speculative.
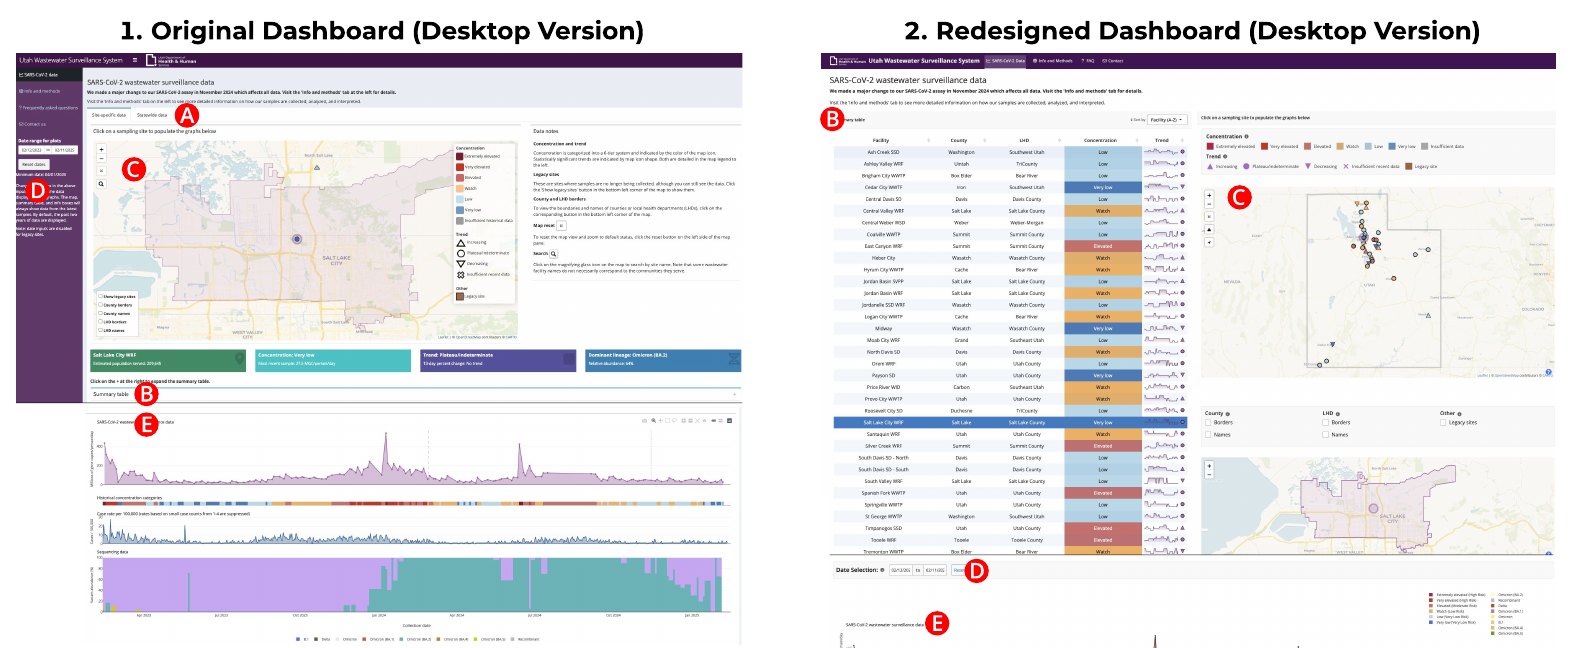
Working with the Utah Department of Health and Human Services, we redesigned the
state’s public wastewater surveillance dashboard to meet accessibility requirements on desktop and
mobile. The paper describes our design decisions, the practical limits of working within a
government system, and feedback from a blind researcher.
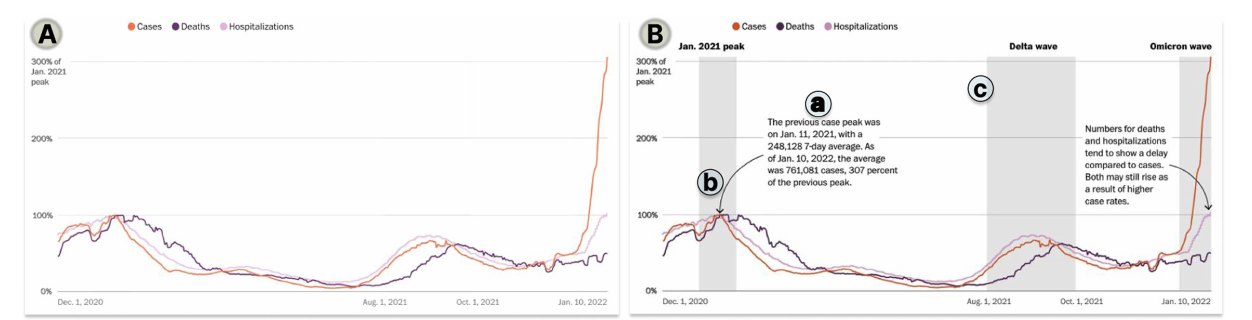
A survey of 191 papers on annotation in visualization. We classify annotations by
type, by how they are created, and by what they refer to, and review their role in engagement,
storytelling, collaboration, and exploratory analysis. All surveyed papers can be explored in an
interactive browser.
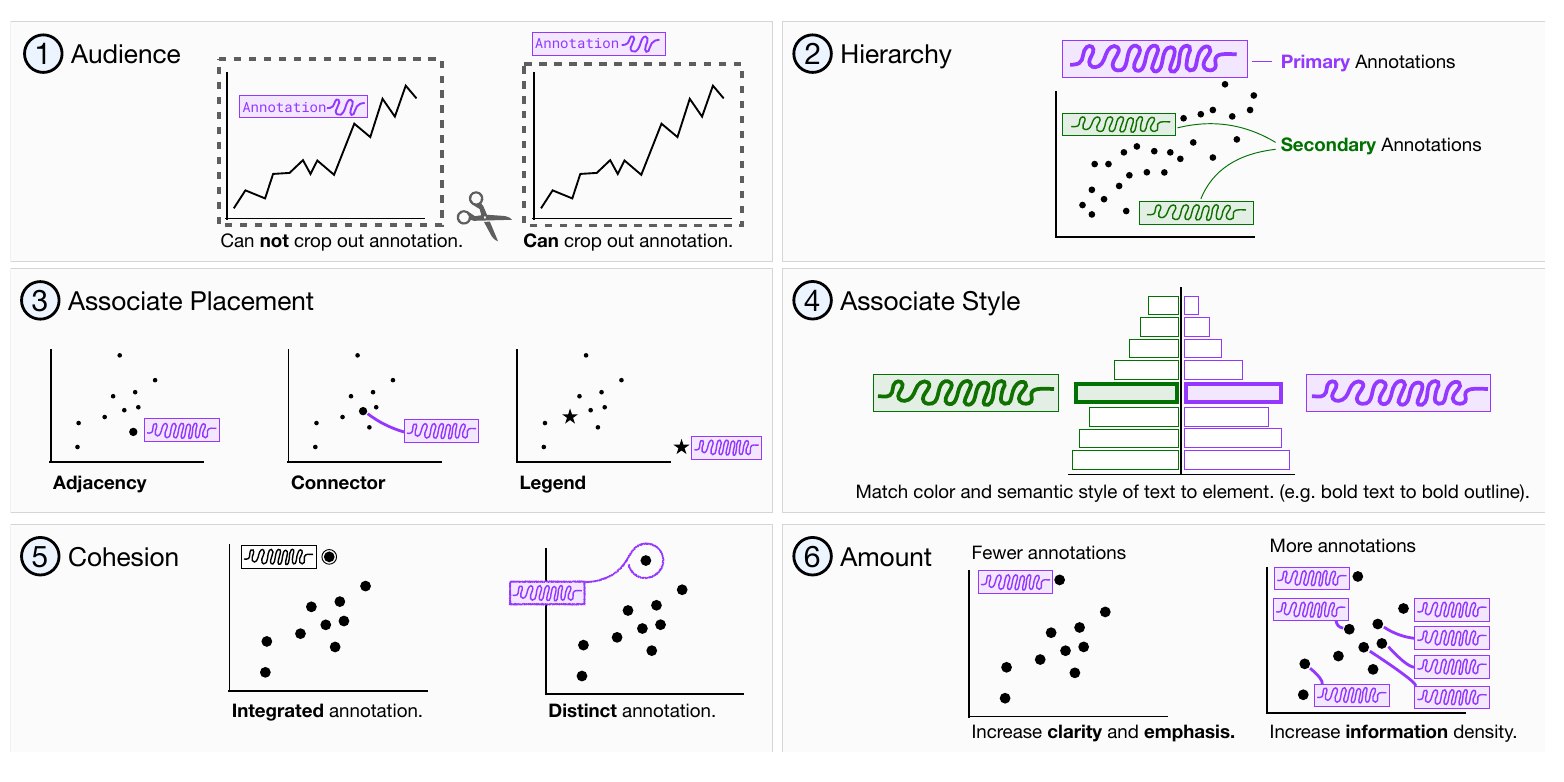
Drawing on interviews with ten practitioners and seven educators, this talk looks at
how professionals decide what to annotate, where to place it, and how much to include. We distill
their practice into six design considerations, each paired with published examples. The paper
appeared in Computer Graphics Forum (EuroVis 2026).




 University of Wisconsin–Madison

 Harvard Medical School

 Autodesk Research

 Université Paris-Saclay

 Inria

 Stanford University

 University of Oklahoma

 University of Utah

 SCI Institute

 University of Stuttgart